Every cell is one point. Drag to pan, scroll to zoom, shift-drag to select a region; click any group in the legend to isolate it. Use Colour cells by to switch between cell type, cluster, library, quality-control metric and the expression of a single gene.
UMAP — this re-analysis
Drawn from the same exported coordinates and labels the interactive atlas above uses, so the figure and the atlas cannot disagree. 36,550 cells.
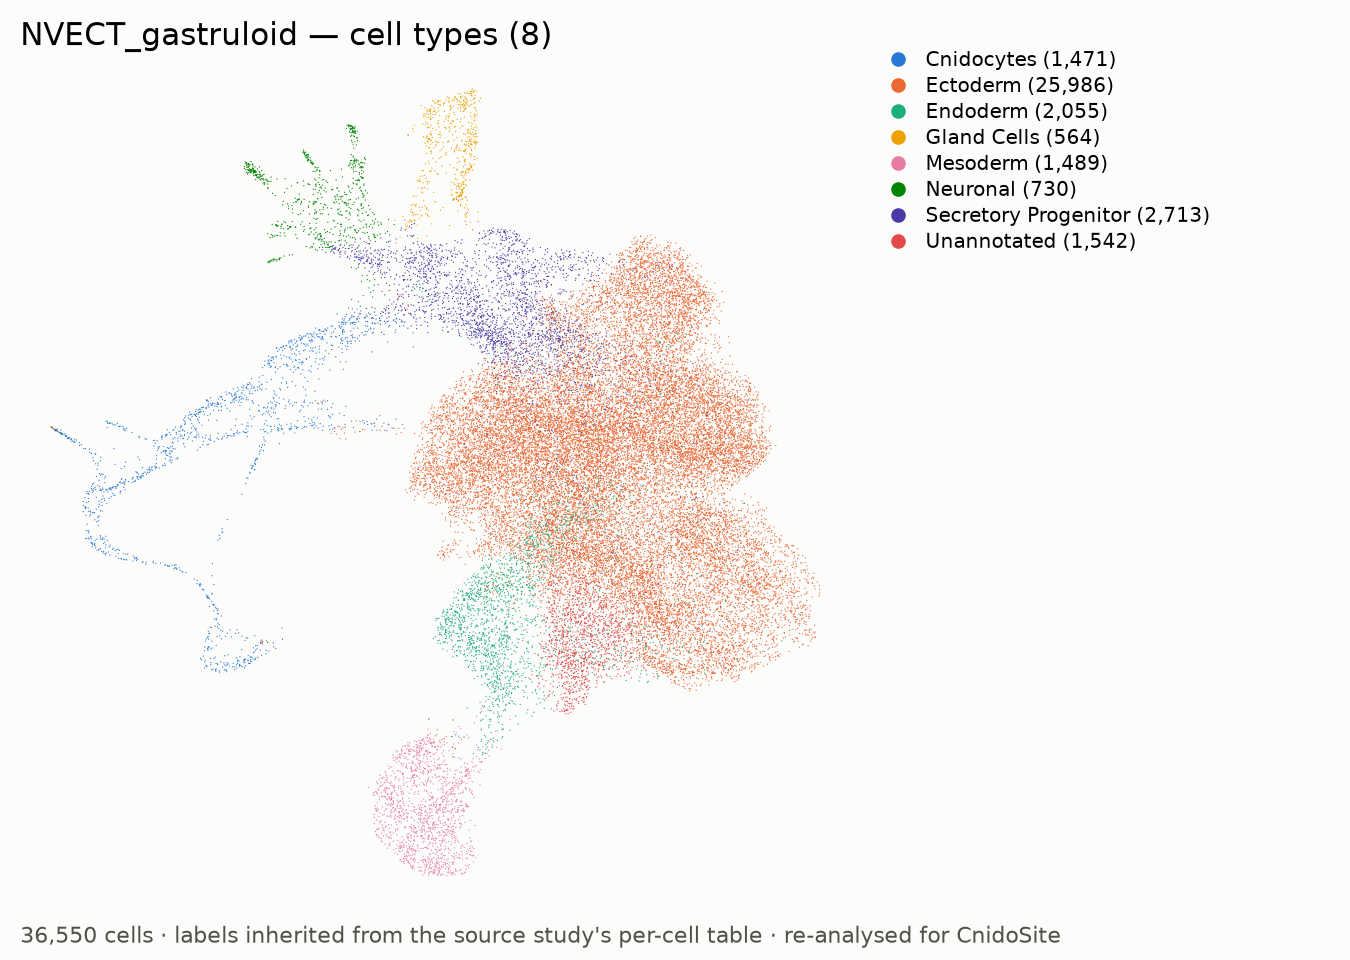
The legend in the panel names every type and its cell count.
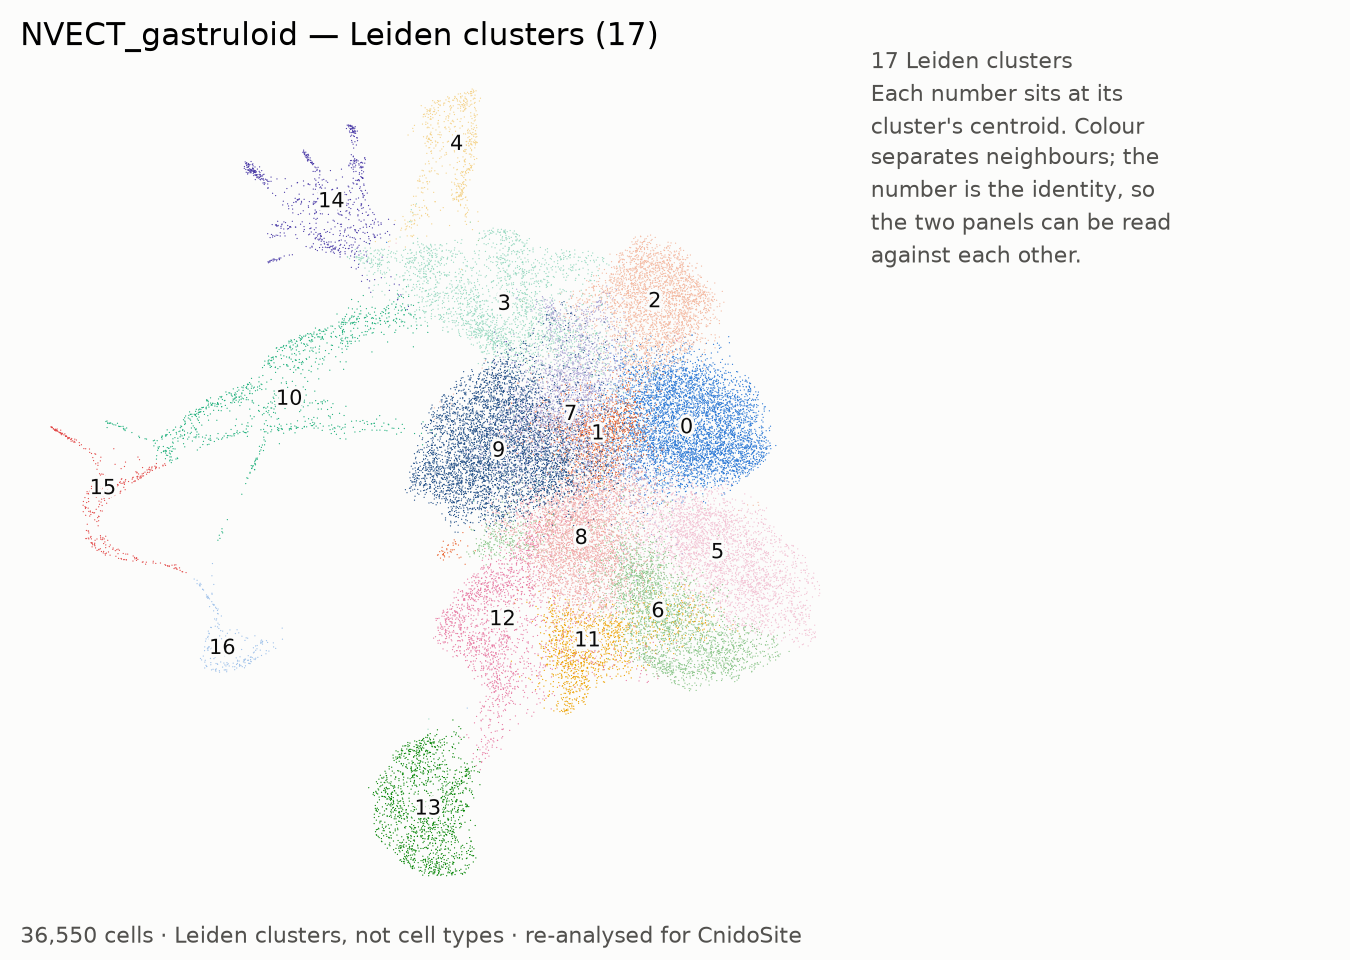
Each cluster's number is placed at its own centroid, so the grouping can be read without relying on colour. These are the clusters the cell-type annotation was built on.
Cell types in this dataset
Click a cell type to isolate it in the atlas above. The bar beside each percentage is drawn to scale: a cell type at 2.6 % fills 2.6 % of the track, so the rows can be ranked by eye without reading the numbers.
| Cell type | Cells | Percent | Markers |
|---|---|---|---|
| Ectoderm | 25,986 | marker genes | |
| Secretory Progenitor | 2,713 | marker genes | |
| Endoderm | 2,055 | marker genes | |
| Unannotated | 1,542 | marker genes | |
| Mesoderm | 1,489 | marker genes | |
| Cnidocytes | 1,471 | marker genes | |
| Neuronal | 730 | marker genes | |
| Gland Cells | 564 | marker genes | |
| 8 cell types | 36,550 |
Quality control for this dataset
These are the figures actually applied to the cells shown above, not the values requested in a configuration file. Every dataset is filtered independently; see Single-cell Data for the full table across all datasets.

