Cell Atlas

Every cell is one point. Drag to pan, scroll to zoom, shift-drag to select a region; click any group in the legend to isolate it. Use Colour cells by to switch between cell type, cluster, library, quality-control metric and the expression of a single gene.

UMAP — this re-analysis

Drawn from the same exported coordinates and labels the interactive atlas above uses, so the figure and the atlas cannot disagree. 21,775 cells.
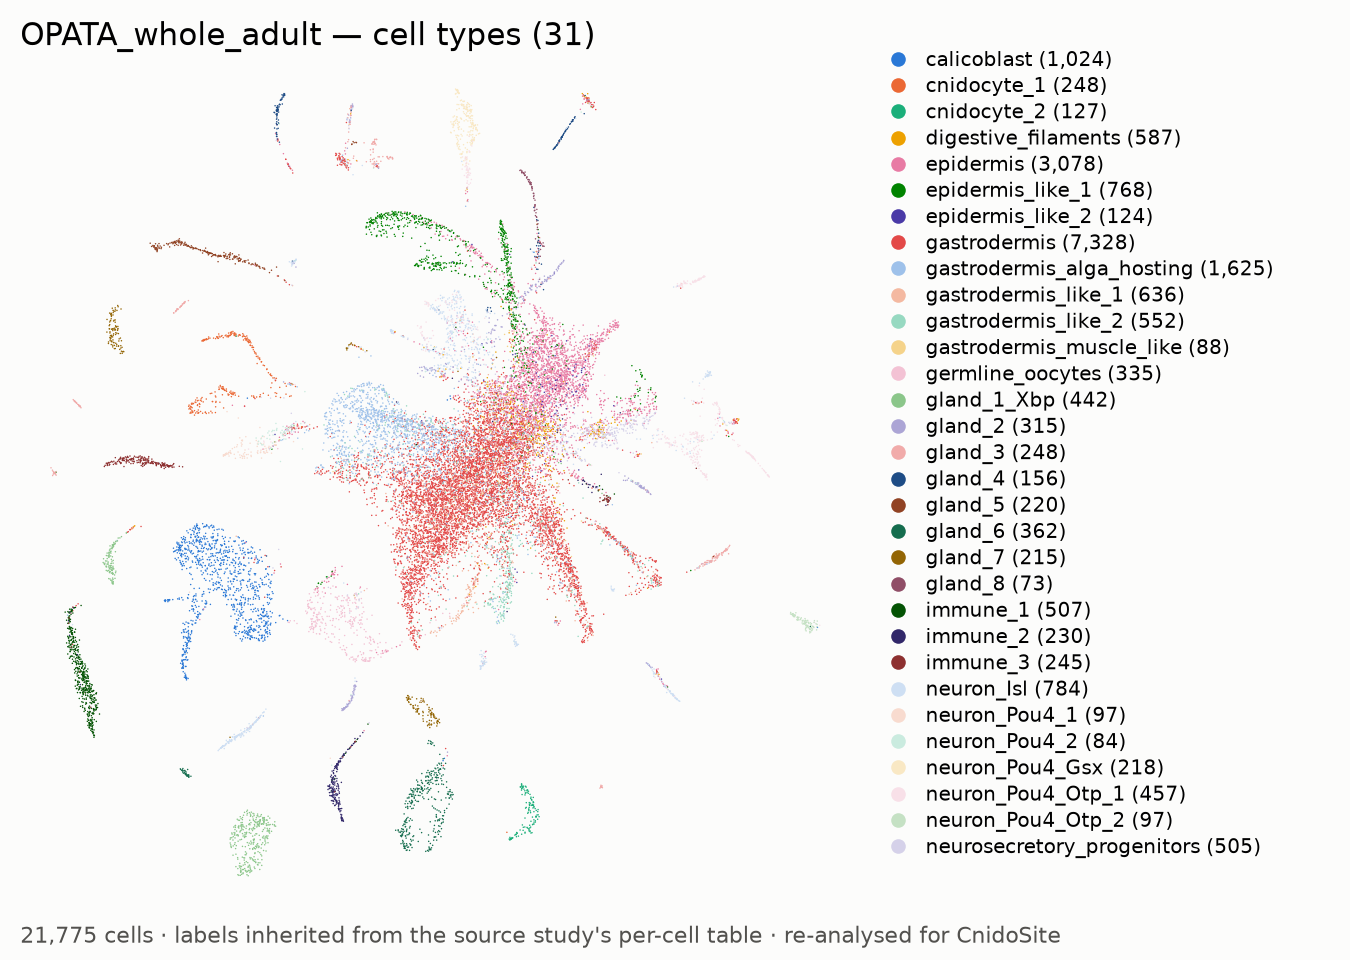
Coloured by cell type (31)
UMAP of the re-analysed OPATA_whole_adult, coloured by annotated cell type, with a legend naming each type

The legend in the panel names every type and its cell count. With 31 types, colour alone no longer separates them — read the legend, not the hue.
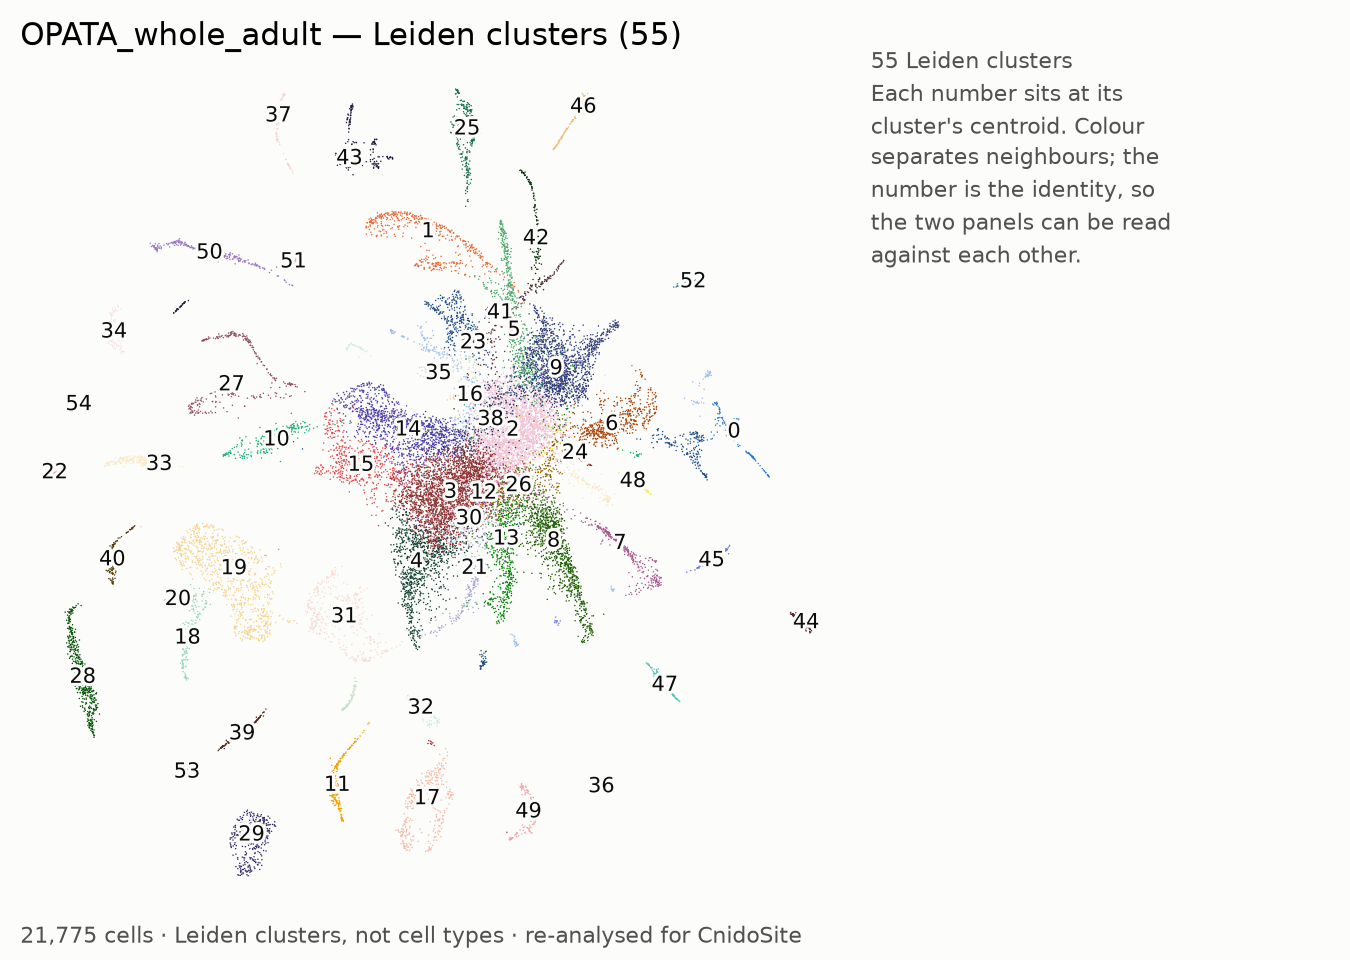
Coloured by Leiden cluster (55)
UMAP of the re-analysed OPATA_whole_adult, coloured by Leiden cluster, each labelled with its number

Each cluster's number is placed at its own centroid, so the grouping can be read without relying on colour. These are the clusters the cell-type annotation was built on.

Cell types in this dataset

Click a cell type to isolate it in the atlas above. The bar beside each percentage is drawn to scale: a cell type at 2.6 % fills 2.6 % of the track, so the rows can be ranked by eye without reading the numbers.

Cell type Cells Percent Markers
gastrodermis 7,328 marker genes
epidermis 3,078 marker genes
gastrodermis_alga_hosting 1,625 marker genes
calicoblast 1,024 marker genes
neuron_Isl 784 marker genes
epidermis_like_1 768 marker genes
gastrodermis_like_1 636 marker genes
digestive_filaments 587 marker genes
gastrodermis_like_2 552 marker genes
immune_1 507 marker genes
neurosecretory_progenitors 505 marker genes
neuron_Pou4_Otp_1 457 marker genes
gland_1_Xbp 442 marker genes
gland_6 362 marker genes
germline_oocytes 335 marker genes
gland_2 315 marker genes
gland_3 248 marker genes
cnidocyte_1 248 marker genes
immune_3 245 marker genes
immune_2 230 marker genes
gland_5 220 marker genes
neuron_Pou4_Gsx 218 marker genes
gland_7 215 marker genes
gland_4 156 marker genes
cnidocyte_2 127 marker genes
epidermis_like_2 124 marker genes
neuron_Pou4_1 97 marker genes
neuron_Pou4_Otp_2 97 marker genes
gastrodermis_muscle_like 88 marker genes
neuron_Pou4_2 84 marker genes
gland_8 73 marker genes
31 cell types 21,775

Quality control for this dataset

These are the figures actually applied to the cells shown above, not the values requested in a configuration file. Every dataset is filtered independently; see Single-cell Data for the full table across all datasets.


Source BioProject PRJNA1223412
SRA study SRP563749
GEO series GSE289546
Library type 10x Genomics Chromium (high confidence)
Libraries integrated 4
Cells reported by source 29723
Cells before filtering 29,723
Cells after cell filtering 21,794
Doublets removed 19 (0.09%)
Cells after filtering 21,775
Retained 73.3%
Filtering strategy Per-library MAD outlier detection (adaptive)
Thresholds applied adaptive: per-library MAD (5.0 MADs) on UMI, genes and MT%, floor 200 genes, floor 500 UMI
Mitochondrial genes found 0 — too few for a reliable MT% filter, so none was applied
Doublet method Scrublet (per library)
Integration method Harmony on sample (4 libraries)
Cell-type annotation Inherited from the source publication
Cell-type labels from GSE289546_Opat.cell_to_cts.csv.gz (100% of cells matched)
Pipeline version cnidosite-sc-1.0.0
Processed 2026-09-20T03:34:23+00:00
Clusters / cell types 55 / 31
TOP