This dataset is shown as the figure published with the source study. It is a static image: the cells behind it were not deposited in a form we could re-analyse, so this projection cannot be recoloured, subset or queried. Datasets we did re-analyse open in the interactive viewer instead — see Single-cell Data for which is which.
UMAP — figure 1, as published
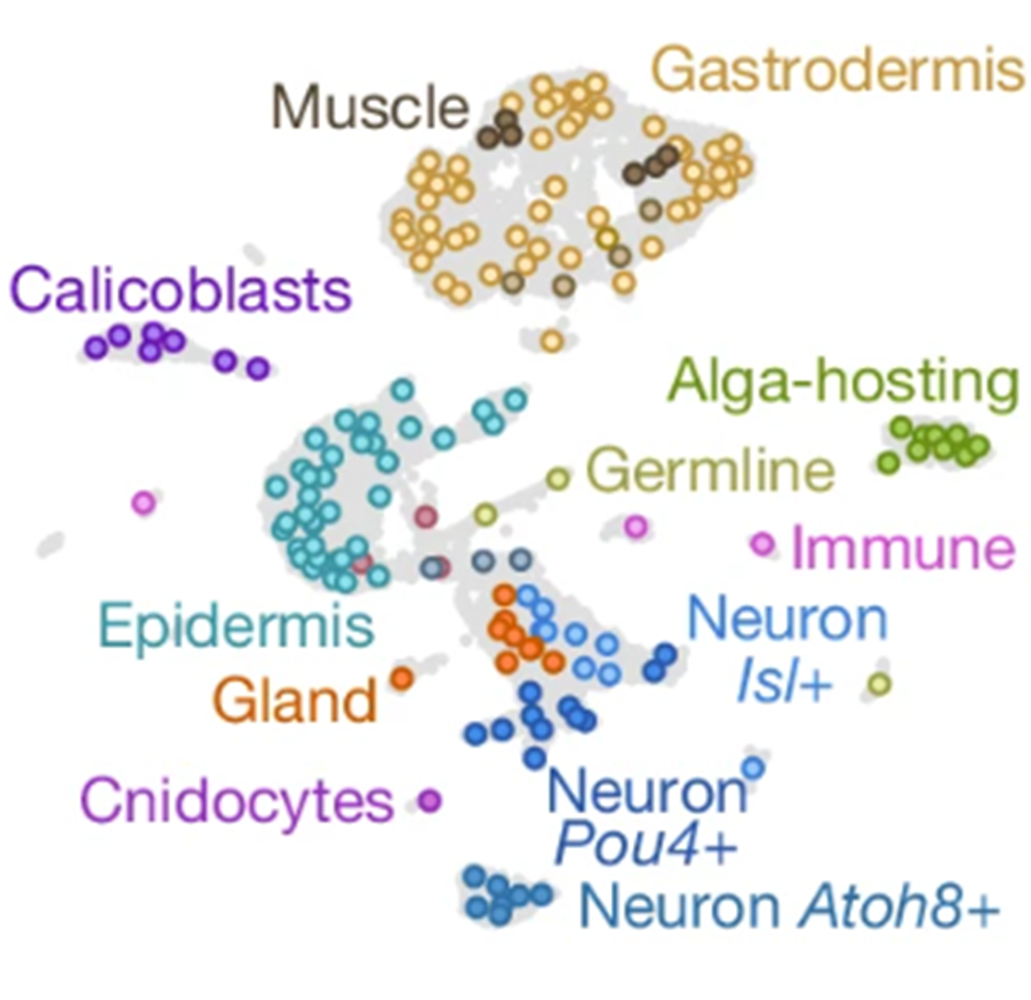
Only one UMAP is shown for this dataset.
For Stylophora pistillata — Whole adults, the
source study deposited two files, but they are byte-identical: the file
previously displayed as a second panel is the same picture as the first, so
it is no longer shown twice.
An interactive version of this dataset is available.
We re-analysed the same tissue and the viewer can recolour it by cell type,
cluster, library and QC metric, or by the expression of a single gene.
Open the interactive atlas →
Cell types in this dataset
25 annotated cell types,
from the marker table SPIST_cellmarker.
Click one to see its marker genes.
germline_oocytes_26847
immune_macrophage5651
immune_macrophage_like_14964
gastrodermis4704
immune_macrophage_like_24275
germline_oocytes_14267
gastrodermis_like_24224
cnidocyte4209
neuron_Atoh84191
neuron_Pou4_Otp4026
calicoblast4003
neuron_Isl_Nkx63906
gastrodermis_alga_hosting3900
neuron_Pou4_Gsx3688
gastrodermis_muscle3620
neuron_Pou4_13555
neuron_Pou4_23467
epidermis3421
neurosecretory_progenitors3406
neuron_Isl3384
immune_nascent3359
gland_1_Xbp3338
gland_23256
gland_33190
digestive_filaments3164

